
Hearing Testing
Diagnostic hearing testing
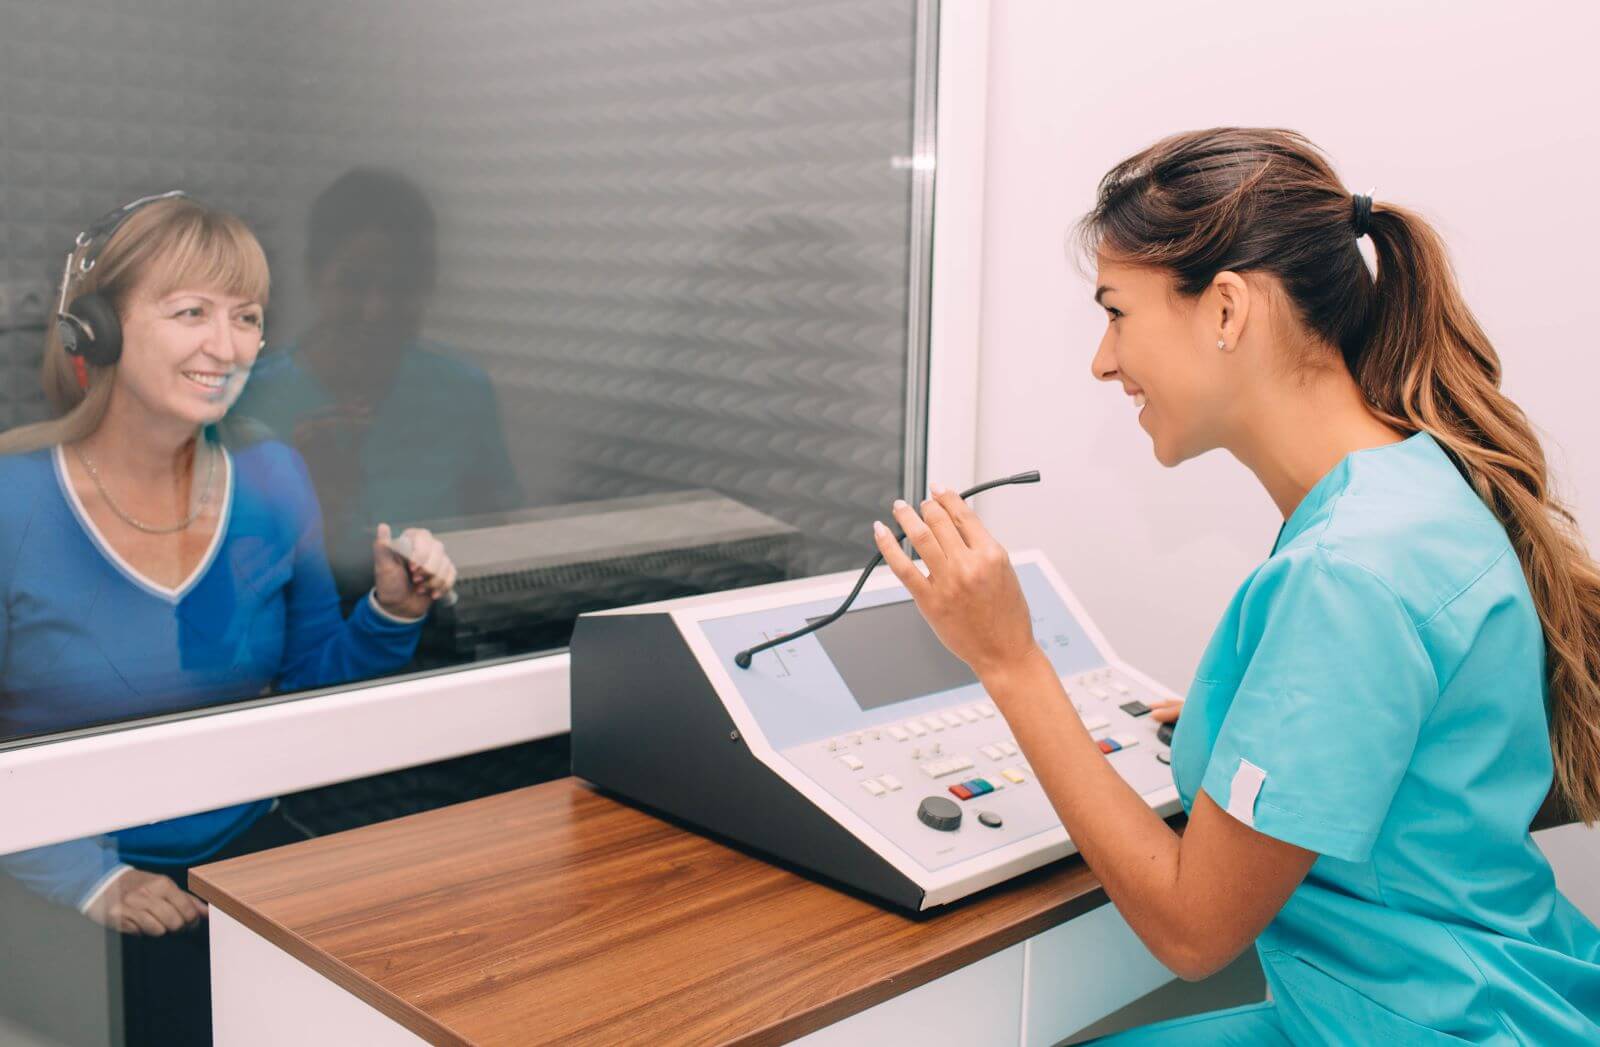
At Hawkins Hearing, we are proud of the quality of service we offer and the help that we give our patients. In order to give you the best help possible, we have invested heavily in state-of-the-art equipment for our office.
We provide comprehensive diagnostic hearing testing, using internationally recognized best practice processes to fully evaluate your hearing and determine the best options for you.
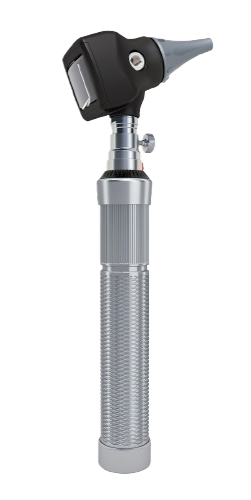
Prior to a hearing test, the audiologist will first examine your ears with an otoscope, looking for any visible conditions which may warrant a medical referral. Next, the hearing test will help determine if a hearing impairment exists and what level that impairment is. This consists of the following tasks:
- Finding the softest level at which you can recognize words and tones
- Determining how well you can understand speech in quiet and noise
Additional testing may include:
Types of Hearing Tests
Hearing Test Results
How to Read an Audiogram
Recording The Hearing Test
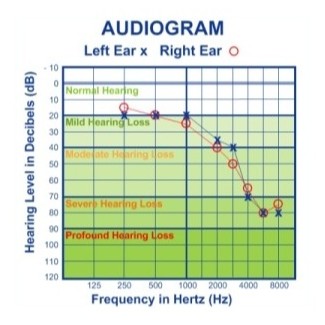
An audiogram is a graph form that we use to record the results of a hearing test. You can see a sample audiogram to the right.
The vertical lines represent the test frequencies, arranged from low pitched on the left to high pitched on the right. Low pitch, is the bass of sound, it is the sound of the vowels or power in speech. High pitch is the treble of sound, it is the sound of the consonants or clarity in speech.
The horizontal lines represent loudness, from very soft at the top to very loud at the bottom.
Circles represent scores for the right ear, and Xs are used for the left ear. The scores are plotted on the audiogram and compared to results obtained from persons with normal hearing (the unshaded area). Speech sounds at an average speech level may also be plotted, to give some information about which sounds are audible to the listener.
Hearing Loss Treatment Solutions